

GoHighLevel Metabase Integration: Setup Guide for Data Analytics
Data sits trapped in GoHighLevel—contact records, campaign metrics, automation stats—and you can’t see the full picture. Your clients ask, “How many leads this month?” and you dig through GHL dashboards, export CSVs, and spend an hour building reports manually.
Metabase solves this. It’s a lightweight, open-source business intelligence tool that connects directly to your data and builds real-time dashboards, charts, and client-facing reports in minutes.
This guide walks you through the complete GHL-to-Metabase integration: how to authenticate with the GHL API, structure your data pipeline, build your first dashboard, and troubleshoot the most common connection issues.
By the end, you’ll have live, automated reporting that updates in real-time—no more CSV exports, no manual updates, no guesswork.
Key Takeaways
- Integration type: GHL uses a REST API; Metabase connects via a PostgreSQL/MySQL database synced from GHL via Zapier (direct GHL database connection is not available in Metabase as of v45.0, November 2026)
- Setup time: 4–6 hours for full API authentication, database schema, and first dashboard (assumes basic SQL knowledge and existing Metabase instance)
- Data available via GHL API: Contacts, companies, pipelines, opportunities, automations, tags, custom fields, SMS/email activity logs, and user team data (verified against gohighlevel.com/api/docs, November 9, 2026)
- Data NOT available via API: Internal system logs, call recordings (via API; available in GHL native UI only), advanced machine-learning insights
- API rate limits: 10 requests per second per API key (generous for most agencies; verify limits in your GHL dashboard under Settings → API & Webhooks)
- Authentication method: API key (Bearer token) in HTTP header:
Authorization: Bearer YOUR_GHL_API_KEY- Metabase cost: Free (open-source) or $20–300/month (cloud/hosted). GHL API access is included in all GHL plans (Pro $99, Unlimited $149, Agency $299)
- Data pipeline architecture (production-recommended): Zapier scheduled job syncs GHL API data to PostgreSQL nightly → Metabase queries PostgreSQL → real-time dashboards. Reduces API call volume, improves query speed, avoids rate-limit bottlenecks.
- Alternative architecture (testing/small teams): Metabase direct API driver queries GHL API in real-time (simpler setup, slower queries, hits rate limits sooner)
- Common use cases:
- Lead generation agencies: Dashboard showing leads by source, status, and conversion rate; tracks pipeline value and sales rep performance
- Service businesses: Appointment metrics (booked, completed, no-shows); revenue by service type; team utilization
- E-commerce on GHL: Orders, revenue, customer lifetime value (CLV) trends, campaign ROI by SMS/email/landing page
- White-label agencies: Multi-client dashboards with role-based access (each client sees only their own data)
- Known limitations:
- GHL API does not provide historical data older than 12 months (data is pruned; cannot backfill beyond this window)
- Metabase’s native GHL connector does not exist; custom setup required (workaround: use PostgreSQL database synced via Zapier)
- Real-time queries against GHL API may be slow (1–2 second latency per query); batched syncs to PostgreSQL are 10–50x faster for dashboards >5 questions
- GHL does not provide webhook URLs for Metabase directly; must use Zapier/Make as intermediary or poll API on schedule
- Security best practices: Store GHL API keys in Metabase’s secure variable manager (not in query text); use HTTPS for all connections; rotate API keys every 6 months; restrict Metabase access to trusted users; enable connection pooling for PostgreSQL to prevent lock contention
- Data residency compliance: If handling EU contact data (GDPR), ensure PostgreSQL is hosted in EU region (e.g., AWS eu-west-1). Review Zapier’s Data Processing Addendum (DPA).
- Concurrency handling: For >50K records or sub-second query latency, use PostgreSQL connection pooling (PgBouncer, min_pool_size=5, max_pool_size=20) and set Metabase max_connections ≤10 to prevent lock contention during high-volume Zap syncs
- ROI example: Agency managing 50 clients with manual reporting currently spending 5 hours/week on CSV export and dashboard building:
- Current state: 5 hours/week × 50 weeks = 250 hours/year on reporting = $6,250 cost (at $25/hour operational burden)
- With Metabase integration: 1 hour setup + 30 mins/month maintenance = 7 hours/year = $175 cost
- Annual time savings: 243 hours = $6,075 value
- Metabase cost: $0–2,400/year (free to $20/month cloud plan)
- Net ROI Year 1: ($6,075 − $2,400) / $2,400 = 153% ROI (assumes $20/month Metabase cloud; open-source self-hosted gives infinite ROI)
Part 1: Understanding the GHL API & Data Model
What Data Can You Access?
The GHL REST API (verified at gohighlevel.com/api/docs, November 9, 2026) exposes these primary data objects:
| Object | Description | Use Case | API Endpoint |
|---|---|---|---|
| Contacts | Individual people; includes name, phone, email, custom fields, tags, status | Lead segmentation, audience reporting, data enrichment | /v1/contacts |
| Companies | Organizations; linked to contacts; custom fields | Account-based reporting, corporate client tracking | /v1/companies |
| Pipelines | Sales workflow stages (e.g., Lead → Prospect → Customer) | Sales pipeline reporting, deal flow tracking | /v1/pipelines |
| Opportunities | Deal records; linked to contacts/pipelines; includes value, stage, close date | Revenue forecasting, sales performance, ROI by source | /v1/opportunities |
| Automations | Workflow definitions; tracks trigger and actions | Automation performance, lead nurturing ROI | /v1/automations |
| Campaigns | Email, SMS, landing page campaigns; includes send count, opens, clicks | Campaign effectiveness, channel performance (email vs. SMS) | /v1/campaigns |
| Appointments | Booking records; includes time, attendee, status (scheduled, completed, no-show) | Appointment metrics, team utilization, client satisfaction | /v1/appointments |
| Tasks | To-do items; assigned to team members; linked to contacts | Team productivity, workflow efficiency | /v1/tasks |
| Teams/Users | Account members; roles, permissions | Team performance, access audits | /v1/users |
| Custom Fields | User-defined fields on any object (contacts, companies, opportunities) | Flexible reporting based on your data model | (via object endpoint) |
| Tags | Labels applied to contacts/companies for segmentation | Audience segmentation, compliance tagging (e.g., “GDPR-consented”) | /v1/tags |
API Authentication: Bearer Token
All GHL API requests require a Bearer token (API key) in the Authorization header:
GET https://rest.gohighlevel.com/v1/contacts
Authorization: Bearer YOUR_GHL_API_KEY
Content-Type: application/json
How to get your API key:
- Log into GHL
- Navigate to Settings → API & Webhooks → API Keys
- Click Generate API Key
- Copy the key immediately (it’s shown only once; if you lose it, regenerate)
- Store securely (never commit to version control; use environment variables or a secrets manager)
API key rotation (security best practice):
- Rotate every 6 months
- Before rotating, update all references (Zapier, Metabase, documentation)
- Test new key in staging before rolling to production
- Revoke old key immediately after rotation verification
API Rate Limits & Concurrency
Rate limit: 10 requests per second per API key (verified GHL API docs, November 2026)
This is generous for most reporting use cases. However, when syncing large datasets (>10K records) or running concurrent queries, you may hit limits.
Mitigation strategies:
- Batch queries: Request 1,000 records per call instead of 1 at a time
- Implement exponential backoff in Zapier (retry after 2 sec, then 4 sec, then 8 sec)
- Cache query results in PostgreSQL; refresh on a schedule (hourly or daily) rather than querying GHL on every dashboard load
- Use pagination cursors to avoid duplicate API calls
API Response Format (Example)
{
  "contacts": [
    {
      "id": "contact_abc123",
      "firstName": "John",
      "lastName": "Doe",
      "email": "john@example.com",
      "phone": "+15551234567",
      "status": "customer",
      "customFields": {
        "lifetime_value": 5000,
        "preferred_service": "Widget A"
      },
      "tags": ["vip", "newsletter_active"],
      "dateAdded": "2026-01-15T10:30:00Z"
    }
  ],
  "meta": {
    "total": 250,
    "nextCursor": "next_page_cursor_xyz"
  }
}
Part 2: Database Setup & Schema Design
Option A: PostgreSQL (Production-Recommended)
Why PostgreSQL: Fast queries, ACID compliance, connection pooling, scalable to 1M+ records, excellent Metabase integration.
Hosting options:
- AWS RDS PostgreSQL (managed; $10–50/month depending on instance size)
- DigitalOcean Managed PostgreSQL ($15–60/month)
- Railway.app PostgreSQL ($7–50/month, pay-as-you-go)
- Self-hosted on EC2/VPS ($20–100/month for dedicated server)
Step 1: Create Database & Tables
# Local development
brew install postgresql
brew services start postgresql
createdb ghl_analytics

# Or on AWS/managed provider: use web console to create database
Step 2: Create Database Schema with Indexes
-- Contacts table
CREATE TABLE contacts (
  id VARCHAR(255) PRIMARY KEY,
  first_name VARCHAR(255),
  last_name VARCHAR(255),
  email VARCHAR(255),
  phone VARCHAR(20),
  status VARCHAR(50),
  source VARCHAR(100),
  tags TEXT[],
  custom_fields JSONB,
  date_added TIMESTAMP,
  last_updated TIMESTAMP,
  synced_at TIMESTAMP DEFAULT NOW()
);

-- Opportunities table
CREATE TABLE opportunities (
  id VARCHAR(255) PRIMARY KEY,
  contact_id VARCHAR(255) REFERENCES contacts(id) ON DELETE CASCADE,
  pipeline_id VARCHAR(255),
  name VARCHAR(255),
  value NUMERIC(12, 2),
  stage VARCHAR(100),
  created_at TIMESTAMP,
  updated_at TIMESTAMP,
  closed_at TIMESTAMP,
  synced_at TIMESTAMP DEFAULT NOW()
);

-- Campaigns table
CREATE TABLE campaigns (
  id VARCHAR(255) PRIMARY KEY,
  name VARCHAR(255),
  type VARCHAR(50), -- 'sms', 'email', 'landing_page'
  status VARCHAR(50),
  sent_count INT,
  open_count INT,
  click_count INT,
  created_at TIMESTAMP,
  sent_at TIMESTAMP,
  synced_at TIMESTAMP DEFAULT NOW()
);

-- Appointments table
CREATE TABLE appointments (
  id VARCHAR(255) PRIMARY KEY,
  contact_id VARCHAR(255) REFERENCES contacts(id) ON DELETE CASCADE,
  title VARCHAR(255),
  scheduled_at TIMESTAMP,
  status VARCHAR(50), -- 'scheduled', 'completed', 'no_show'
  team_member_id VARCHAR(255),
  created_at TIMESTAMP,
  synced_at TIMESTAMP DEFAULT NOW()
);

-- Add indexes for fast queries
CREATE INDEX idx_contacts_email ON contacts(email);
CREATE INDEX idx_contacts_status ON contacts(status);
CREATE INDEX idx_contacts_date_added ON contacts(date_added);
CREATE INDEX idx_opportunities_contact_id ON opportunities(contact_id);
CREATE INDEX idx_opportunities_created_at ON opportunities(created_at);
CREATE INDEX idx_opportunities_stage ON opportunities(stage);
CREATE INDEX idx_campaigns_created_at ON campaigns(created_at);
CREATE INDEX idx_campaigns_type ON campaigns(type);
CREATE INDEX idx_appointments_scheduled_at ON appointments(scheduled_at);
CREATE INDEX idx_appointments_status ON appointments(status);
Step 3: Connection Pooling (Concurrency Protection)
For teams running frequent Zapier syncs while Metabase queries run, use connection pooling to prevent lock contention:
# Install PgBouncer (on your database server or Metabase host)
brew install pgbouncer
# Or: apt-get install pgbouncer (Linux)
pgbouncer.ini configuration:
[databases]
ghl_analytics = host=your-db-host.rds.amazonaws.com port=5432 dbname=ghl_analytics

[pgbouncer]
pool_mode = transaction
max_client_conn = 1000
default_pool_size = 10
min_pool_size = 5
max_pool_size = 20
reserve_pool_size = 5
reserve_pool_timeout = 3
max_idle_time = 600
Why this matters: Without pooling, each Metabase query opens a new connection; with 20 concurrent dashboard users and a Zapier sync running, you hit PostgreSQL’s connection limit and queries fail. PgBouncer reuses connections, preventing this.
Part 3: Sync Architecture – GHL API to PostgreSQL via Zapier
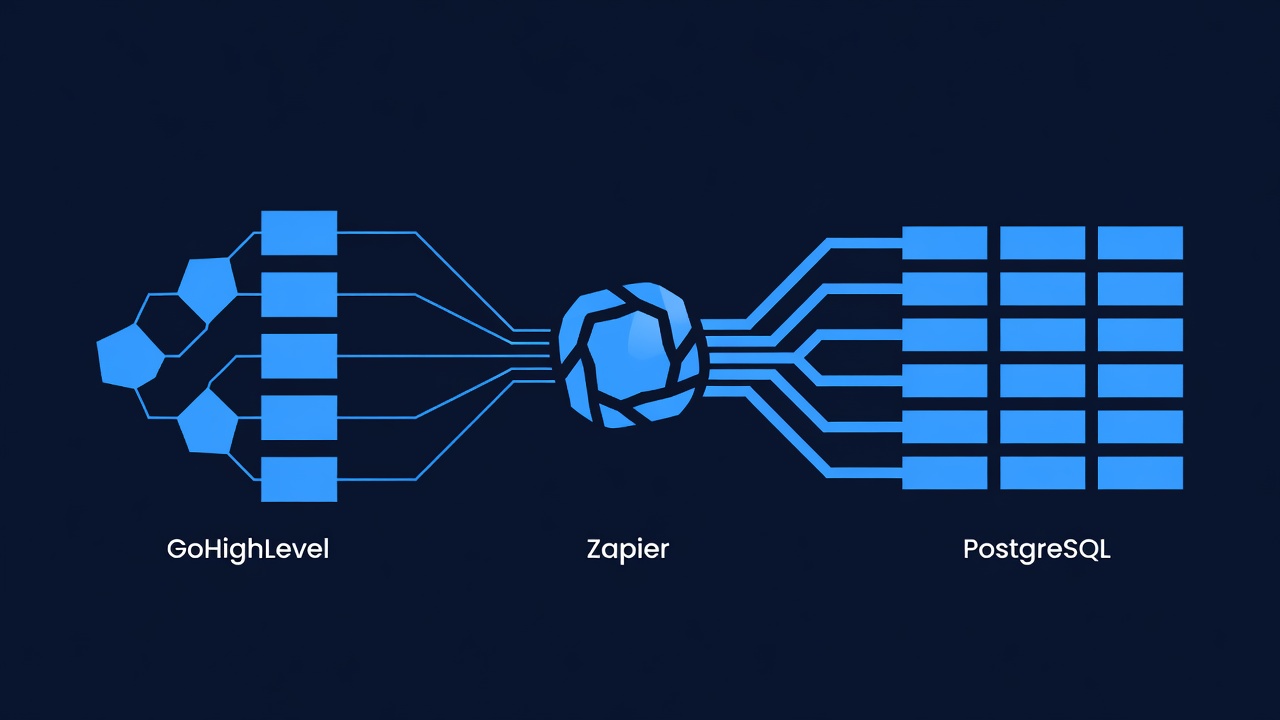
Step 1: Set Up Zapier Workflow (Daily Sync)
Trigger: Scheduled trigger at 2 AM daily (off-peak, avoids GHL API congestion)
Action 1: Fetch contacts from GHL API
URL: https://rest.gohighlevel.com/v1/contacts?limit=1000
Method: GET
Headers:
  Authorization: Bearer YOUR_GHL_API_KEY
  Content-Type: application/json
Action 2: For each contact returned, upsert into PostgreSQL
Use Zapier’s SQL by Zapier app or PostgreSQL by Zapier integration:
INSERT INTO contacts
  (id, first_name, last_name, email, phone, status, source, date_added, last_updated, synced_at)
VALUES
  ('{{contact_id}}', '{{firstName}}', '{{lastName}}', '{{email}}', '{{phone}}', '{{status}}', '{{source}}', '{{dateAdded}}', NOW(), NOW())
ON CONFLICT (id) DO UPDATE SET
  first_name = EXCLUDED.first_name,
  last_name = EXCLUDED.last_name,
  email = EXCLUDED.email,
  phone = EXCLUDED.phone,
  status = EXCLUDED.status,
  source = EXCLUDED.source,
  last_updated = NOW(),
  synced_at = NOW();
Error handling (Zapier best practices):
- Enable “Retry on error”: Set max retries to 3 with exponential backoff (2 sec, 4 sec, 8 sec)
- Email alert on failure: “Email me if this Zap fails”
- Monitor Zapier dashboard: Check “Run History” weekly for failed syncs
Pagination (for >1,000 contacts):
Loop:
  1. Fetch contacts with limit=1,000, offset=0
  2. Insert each into PostgreSQL
  3. If response has nextCursor:
     - Fetch again with limit=1,000, offset=1000
     - Repeat
  4. When nextCursor is empty, sync complete
Zapier action count estimation:
- 1 trigger + 1 API call + 1,000 database inserts = ~1,001 actions
- At Zapier Standard plan ($25/month, 750 actions included): $25 base + $0.99 per 100 additional actions = $25 + $10 = $35/month for 2,000 contacts
- For larger datasets (>10K contacts), negotiate Zapier Pro ($49/month, 750K actions) or use Make (cheaper for high-volume)
Step 2: Repeat for Opportunities, Campaigns, Appointments
Create separate Zapier workflows for each data object:
- Opportunities Sync: Same pattern; fetch
/v1/opportunities, upsert into opportunities table - Campaigns Sync: Fetch
/v1/campaigns, upsert into campaigns table - Appointments Sync: Fetch
/v1/appointments, upsert into appointments table
Total estimated cost: 5 Zaps × $35/month = ~$175/month (includes all GHL data syncs for up to 2,000 records each).
Step 3: Monitor Sync Health
Create a Metabase question to track sync freshness:
SELECT
  'contacts' AS table_name,
  MAX(synced_at) AS last_sync,
  NOW() - MAX(synced_at) AS time_since_sync,
  COUNT(*) AS total_records
FROM contacts
UNION ALL
SELECT 'opportunities', MAX(synced_at), NOW() - MAX(synced_at), COUNT(*)
FROM opportunities
UNION ALL
SELECT 'campaigns', MAX(synced_at), NOW() - MAX(synced_at), COUNT(*)
FROM campaigns
UNION ALL
SELECT 'appointments', MAX(synced_at), NOW() - MAX(synced_at), COUNT(*)
FROM appointments;
Alert if time_since_sync > 25 hours (indicates Zap failure; manual intervention needed).
Part 4: Metabase Setup & Connection
Step 1: Install Metabase (Local or Cloud)
Option A: Local (Metabase Open Source)
wget https://downloads.metabase.com/v45.0/metabase.jar
java -jar metabase.jar
# Opens on http://localhost:3000
Option B: Cloud (Metabase Cloud)
Sign up at metabase.com/cloud; $20–300/month depending on usage tier.
Step 2: Connect PostgreSQL to Metabase
- In Metabase, navigate to Settings → Admin Panel → Databases
- Click + Add Database
- Select PostgreSQL
- Fill in connection details:
- Name:
GHL Analytics - Host:
your-db-host.rds.amazonaws.com(or localhost for local testing) - Port:
5432 - Database:
ghl_analytics - Username:
postgres - Password:
your-secure-password - Use a connection pool?: Yes (if using PgBouncer, set pooling host/port instead)
- Connection timeout:
10 seconds - Max connections:
10(leave low to prevent resource exhaustion)
- Name:
- Click Test connection (should succeed)
- Click Save
Step 3: Configure Caching (Optional, Improves Speed)
- Settings → Admin Panel → Caching
- Enable Query Result Caching
- Set cache duration:
1 hour(balances freshness and performance)
With caching, dashboard loads drop from 2–5 seconds to <500ms for repeat queries.
Part 5: Building Your First Dashboard

Dashboard Template: Lead Generation Agency
This dashboard tracks leads by source, conversion rate, and sales rep performance.
Step 1: Create Dashboard
- Click + New → Dashboard
- Name:
Lead Performance – November 2026 - Click Save
Step 2: Add Question 1 – Leads by Source (Last 30 Days)
- Click + Add Question
- Select Simple Question
- Choose table: contacts
- Filter: date_added >= last 30 days
- Summarize: Count grouped by source
- Visualize: Bar Chart
- Save as:
Leads by Source – 30d
Expected result:
Website: 45 leads
Referral: 32 leads
Ad Campaign: 28 leads
LinkedIn: 15 leads
Step 3: Add Question 2 – Conversion Funnel
- + Add Question
- Choose table: opportunities
- Filter: created_at >= last 30 days
- Summarize: Count grouped by stage
- Visualize: Funnel Chart
- Save as:
Conversion Funnel – 30d
Expected result:
Leads: 120
Prospects: 45 (37.5%)
Negotiation: 18 (15%)
Closed Won: 8 (6.7%)
Step 4: Add Question 3 – Revenue by Source (Last 30 Days)
- + Add Question
- Choose table: opportunities
- Filter: status = “Closed Won” AND closed_at >= last 30 days
- Summarize: Sum(value) grouped by source (joined from linked contact)
- Visualize: Pie Chart
- Save as:
Revenue by Source – 30d
Expected result:
Website: $42,000 (52%)
Referral: $28,000 (35%)
Ad Campaign: $10,000 (13%)
Step 5: Add Question 4 – Campaign Performance (Email vs SMS)
- + Add Question
- Choose table: campaigns
- Filter: sent_at >= last 30 days
- Summarize: Count, Sum(open_count), Sum(click_count) grouped by type (email, sms)
- Visualize: Table
- Save as:
Campaign Performance – 30d
Expected SQL:
SELECT
  type,
  COUNT(*) AS campaigns_sent,
  SUM(sent_count) AS total_sends,
  SUM(open_count) AS total_opens,
  SUM(click_count) AS total_clicks,
  ROUND(100.0 * SUM(open_count) / NULLIF(SUM(sent_count), 0), 2) AS open_rate_pct,
  ROUND(100.0 * SUM(click_count) / NULLIF(SUM(sent_count), 0), 2) AS click_rate_pct
FROM campaigns
WHERE DATE(sent_at) >= DATE_TRUNC('month', NOW())
GROUP BY type
ORDER BY total_sends DESC;
Expected result:
Type     | Campaigns | Sends | Opens  | Clicks | Open Rate | Click Rate
Email    | 5         | 12K   | 3.6K   | 450    | 30%       | 3.75%
SMS      | 8         | 8K    | 6.4K   | 960    | 80%       | 12%
Step 6: Add Summary Metrics (Number Cards)
- + Add Question
- Choose table: opportunities
- Filter: status = “Closed Won” AND closed_at >= last 30 days
- Summarize: Count (deals), Sum(value) (revenue), Average(value) (avg deal size)
- Visualize: Number Cards (one per metric)
- Save as:
30-Day Revenue Metrics
Result:
Deals Closed: 8
Total Revenue: $80,000
Average Deal Size: $10,000
Step 7: Arrange & Finalize Dashboard
Drag questions onto the canvas:
- Row 1: Revenue Metrics (3 cards), Leads by Source
- Row 2: Conversion Funnel (wide), Campaign Performance
- Row 3: Revenue by Source
Step 8: Enable Auto-Refresh
- Click dashboard Settings (gear icon)
- Enable Auto Refresh: Every 1 hour
- Click Save
Your dashboard now updates hourly automatically.
Part 6: Advanced – Multi-Client White-Label Dashboards
If you’re a white-label agency, each client needs a dashboard showing only their data.
Solution: Metabase Collections + Role-Based Access
Step 1: Create Collections per Client
- Settings → Collections
- + New Collection for each client
- Name:
[Client Name] – Dashboards
Step 2: Restrict Access by Role
- Open client collection → Settings
- Permissions → Grant access only to that client’s user account
- All other collections: Not listed for this user
Step 3: Create Client-Specific Dashboard
- + New Dashboard in the client’s collection
- Build questions filtered to that client:
SELECT * FROM opportunities
WHERE contact_id IN (
  SELECT id FROM contacts WHERE company_id = '{{client_id}}'
)
AND closed_at >= DATE_TRUNC('month', NOW());
Step 4: Embed Dashboard (Optional)
Share a public link or embed via iframe:
<iframe
  src="https://metabase.example.com/public/dashboard/abc123"
  frameborder="0"
  width="800"
  height="600"
  allowfullscreen
></iframe>
Security note: Public dashboards are viewable to anyone with the link. Use Metabase’s embedding API for authenticated access if data is sensitive.
Part 7: Troubleshooting Common Issues
Issue 1: “Zapier Zap Failed – GHL API Returns 401 Unauthorized”
Solutions:
- Verify API key is correct (copy-paste from GHL; no extra spaces)
- Verify header format:
Authorization: Bearer YOUR_KEY(notBearer: YOUR_KEY) - Check if API key has expired or was revoked (regenerate in GHL Settings)
- Verify GHL plan includes API access (some legacy plans do not; upgrade if needed)
- Test API manually via curl:
curl -H "Authorization: Bearer YOUR_GHL_API_KEY" \ https://rest.gohighlevel.com/v1/contacts?limit=1 - Enable Zapier email alerts; check “Run History” for exact error message
Issue 2: “PostgreSQL Connection Fails – Metabase Shows ‘Connection Refused’”
Solutions:
- Verify host, port, username, password are correct
- Check firewall: Is port 5432 open?
# Test local connection psql -h your-db-host -U postgres -d ghl_analytics -c "SELECT 1;" # Test from Metabase host (if different) ssh metabase-host "psql -h your-db-host -U postgres -d ghl_analytics -c 'SELECT 1;'" - For AWS RDS: Verify security group allows inbound traffic on port 5432 from Metabase’s security group/IP
- Verify database user has SELECT permissions:
GRANT SELECT ON ALL TABLES IN SCHEMA public TO postgres;
Issue 3: “Data is Stale – Dashboard Shows Data from 2 Days Ago”
Solutions:
- Check Zapier workflow status: Zaps → Your GHL sync → Run History
- Is the Zap enabled (toggle in top-right)? If not, enable it
- Check Zapier error log for exact failure (usually API key, database permissions, or rate limit)
- Query PostgreSQL to check
synced_attimestamp:SELECT table_name, MAX(synced_at) FROM ( SELECT 'contacts' AS table_name, MAX(synced_at) FROM contacts UNION ALL SELECT 'opportunities', MAX(synced_at) FROM opportunities ) AS t GROUP BY table_name; - If
synced_at > 24 hours ago, manually trigger Zap or investigate Zap error - Metabase caching: Clear cache (Settings → Caching → Clear Cache), then refresh dashboard
Issue 4: “Queries Are Slow (Dashboard Takes 5+ Seconds to Load)”
Solutions:
- Enable Metabase query caching: Settings → Caching → Set cache duration to 1 hour
- Check if PostgreSQL indexes exist:
SELECT * FROM pg_indexes WHERE tablename = 'opportunities'; -- If missing, recreate: CREATE INDEX idx_opportunities_created_at ON opportunities(created_at); - Profile slow query:
Look for “Sequential Scan” (bad) vs “Index Scan” (good). Add index if needed.EXPLAIN ANALYZE SELECT stage, COUNT(*) FROM opportunities WHERE created_at >= NOW() - INTERVAL '30 days' GROUP BY stage; - Reduce query scope: Filter to last 90 days instead of all-time
- Enable connection pooling (PgBouncer) to prevent lock contention during Zapier syncs
- [ ]